
At some point, I realized I was spending more time checking whether my services were still alive than actually using them.
The information was already there. Discord bots had logs. Trading APIs had health endpoints. Servers could be checked over SSH. But when something went wrong, I had to open several places and slowly assemble an answer. By the time I knew what was happening, I was doing archaeology instead of monitoring.
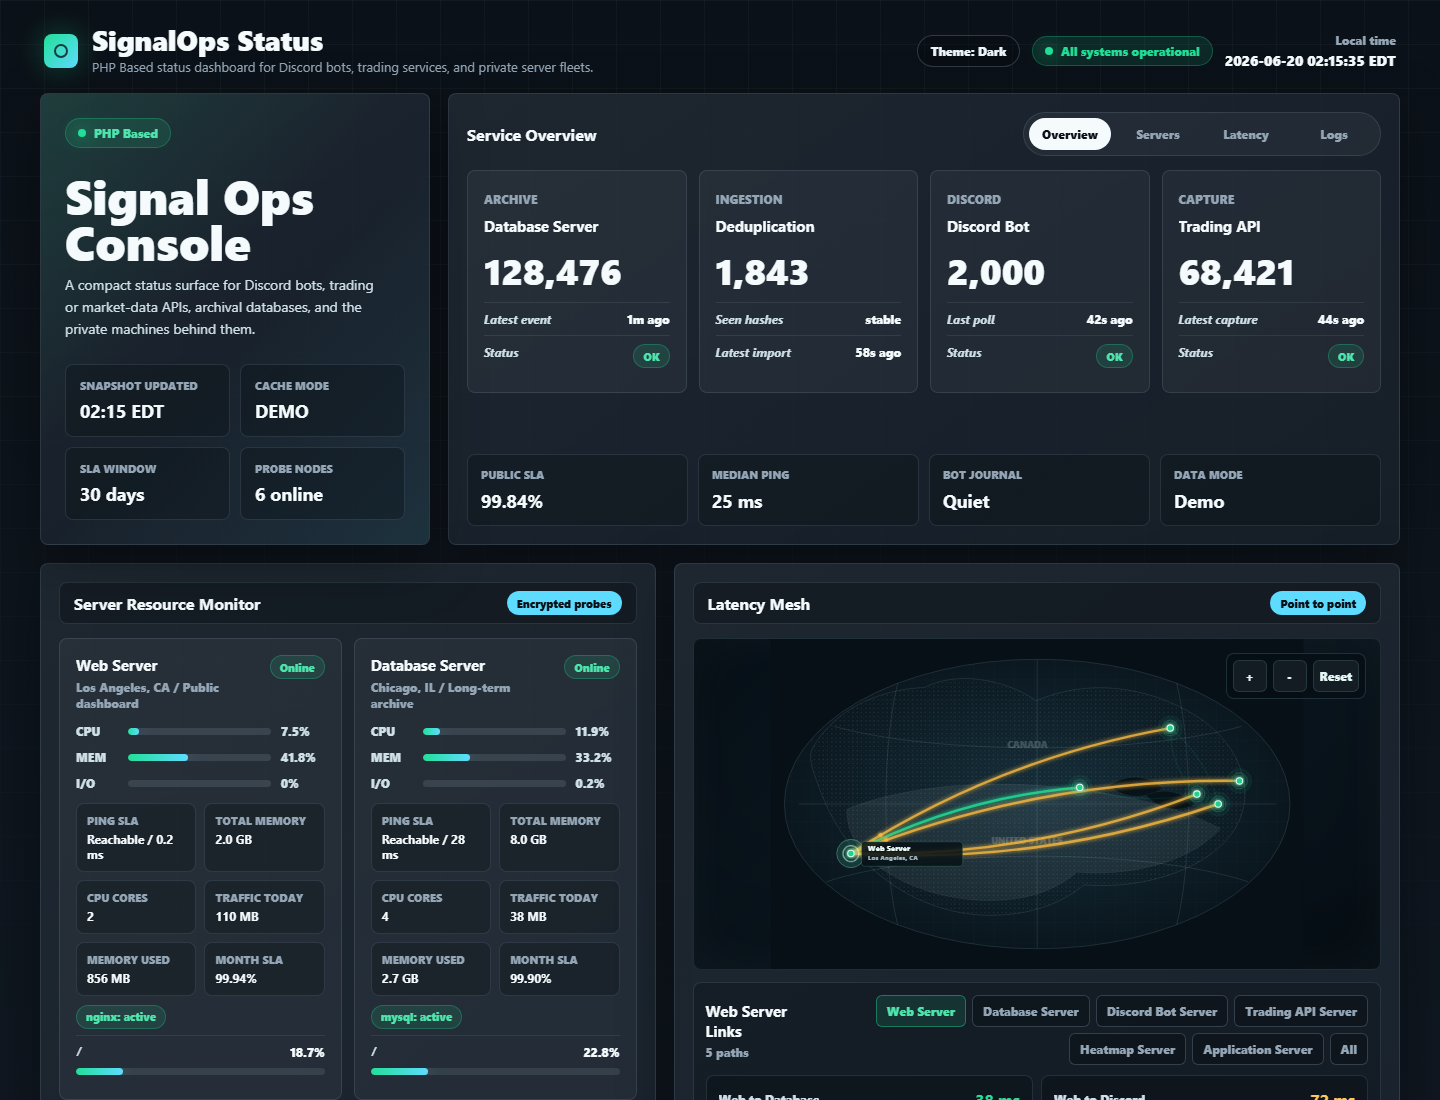
That was the beginning of SignalOps Status. I did not set out to build another giant observability platform. I wanted one page I could open every morning and understand in a few seconds: what is healthy, what is stale, which machine is struggling, and whether “everything is fine” really means anything.
The first thing I had to untangle
At first, I wanted a simple green OK and a red DOWN. That idea lasted about five minutes. A server being reachable is not the same as a bot being healthy. An API returning HTTP 200 is not proof that the data is fresh. A process can be running while the thing people depend on is quietly broken.
So I started treating “status” as a few different questions:
- Is the service healthy? For example, can the Discord bot or trading API answer its health endpoint?
- Is the machine healthy? What do CPU, memory, I/O wait, disk, uptime, and systemd services look like?
- Is the network behaving? Can the machines reach each other, and what does point-to-point latency look like?
- Is the data fresh? When was the last capture, import, or archive event?
Keeping ping-only SLA separate from service health turned out to matter a lot. “The server answers ping” is useful information, but it is not the same as “the bot can still deliver a signal.”
Why I kept it plain PHP
I could have started with a JavaScript build pipeline, a frontend framework, and a few more services to keep track of. I did not want that for this project. I wanted to be able to drop it onto a normal PHP hosting panel and still understand how it worked six months later.
That is why the dashboard is PHP-rendered, with only a small amount of browser-side interaction. Demo mode is enabled by default, so a fresh clone is not an empty shell. The first local check is intentionally boring:
php -S 127.0.0.1:8080 -t publicIt is not the most fashionable architecture. It is just a good fit for a status page whose first job is to be quick to install and easy to trust.
The parts I did not want to fake
The first one was caching. If every page request triggers a fresh SSH probe or a live request to every endpoint, the status page can become the least reliable service in the system. SignalOps uses a stale-first approach instead: serve the latest usable snapshot, refresh it in the background, and say when that snapshot was created.
The second one was redaction. Logs and health payloads have a habit of containing more than they should: URLs, private IPs, bearer tokens, Discord bot tokens, long IDs, or something written as password=.... A public status page should explain a problem without publishing the secret that caused it.
The third one was SSH probing. The recommended setup is not “give the web server a root key and hope for the best.” It is a restricted key or a forced command that can run one short probe. Production configuration belongs outside the web root, and an optional database summary should use a read-only account.
What it is not trying to become
SignalOps Status is not meant to replace Grafana, Prometheus, or Datadog. It is a status surface for Discord alert bots, trading services, market-data APIs, and small private fleets. The goal is to make the first minute of an incident less confusing, not to store every metric forever.
That is also why I kept the latency map small and included notes for Cloudflare caching and private operator pages. A public page can be fast and slightly stale. An authenticated journal or diagnostic page should not accidentally become public CDN content.
Where I ended up
SignalOps Status started with a very small complaint: I wanted to know whether everything was still alive without opening five different windows. It has grown into something I can deploy for a community or a small trading setup, but it still feels like the same tool.
It takes a messy set of signals and puts them on one page. Then, if something really is wrong, I can spend my time fixing it instead of figuring out where to look.